Category Archives: modelling & sci/tech

Greater Toronto Area transit map

Many years ago, when Google first released Google Maps and revolutionized online mapping from the stagnant MapQuest era, I put together a few quick demos showing the Vancouver and Toronto transit maps. I’ve made a few updates over the years since then, but not much more.  The Vancouver one is still quite popular – more popular than TransLink’s own map, to be honest – but other web gurus made better Toronto maps, such as the excellent one by Ian Stevens.
I’ve noticed that Google has revamped the mapping APIs and is preparing to eliminate version 2.0. The whole treatment of online mapping is changing rapidly, as the mobile market takes off. I was thinking of just scrapping the Toronto map since it’s not well-used – but then I thought a little further. What if I could make a proper map of the Greater Toronto Area?  Ian’s map doesn’t cover that – in fact, since there isn’t even a good print product covering the full area. Perhaps I could make something useful for the “regional traveller” using GO, and also help mobile users who have trouble with Ian’s site.
I set to work, borrowing liberally from others. It’s a patchwork by nature, since each agency has its own colour and line conventions, but hopefully still useful. When Ian made his map, taking a bitmap image and turning it into tiles was a bleeding-edge endeavour and required painstaking effort – but the tools have improved a lot. Even still, a bitmap this size (35,000 pixels square) takes some horsepower. I didn’t have the energy to do everything Ian did (like removing the background); his map will still probably work better for most TTC riders. I also couldn’t figure out what map projection Oakville Transit used, and couldn’t get it to line up nicely with the other data.
I’ll probably do a few more revisions on this in the next few months – an adjustable opacity slider would be nice, a legend for each operator, and higher zoom levels. But I thought I’d release a beta version and see if anyone likes it, and see how expensive the bandwidth is.
Version 3 of my map is now up (and version 2 is still around for anyone who wants it). New in this version:

  • Local transit operator maps
  • More mobile friendly: full-screen view by default, location-aware (uses GPS to detect your current location, if available)
  • May seem slower, unless you have a new browser, like Google Chrome or Firefox 4
  • Graphics updates: labels cleaner, interchange stations cleaner, labels always visible instead of showing on hover (for touchscreen users)
  • Search tries to find a transit station first, otherwise tries other non-transit locations
  • No legend… yet
  • Added “Get directions to here” link to each station
  • API version 3
  • Fixes: added Lincolnville station, fixed broken links
Canadian Government Scraps Long-Form Census

An appalling decision from the Canadian federal government today, reported by the Globe & Mail here: “Tories scrap mandatory long-form census”
The census is a vital data source for all sorts of transportation and land use planning.  A voluntary census is nearly useless, since the sample will suffer from voluntary response bias.  This will do nothing to reduce the number of analysts and bureaucrats – provincial governments will be forced to step in and collect the same data themselves, but this will inevitably result in the loss of province-to-province comparisons.
As for privacy, the alleged basis for this decision: Statistics Canada jumps through all sorts of hoops to ensure the privacy of respondents.  It would be difficult if not impossible to connect any of the published census data back to an individual.  Yes, the questions are detailed and probing; but the anonymization process used by Stats Can is tougher  than anywhere else in the world that I’ve seen.

Transportation Research Board template for LaTeX

Last summer, I submitted my first paper to the Transportation Research Board (TRB) conference (ultimately accepted, and presented in January 2009). They have recently started accepting papers in PDF form instead of requiring a Word file—and this meant that I could write my paper in LaTeX, my preferred document processing system.
However, TRB doesn’t provide any LaTeX templates, so I took a shot at rolling my own based on the TRB Style Manual. It’s very primitive in its present state, but it’ll handle the page layout, headings, captions, fonts, and bibliography style.
Unfortunately, they still require a Word document if you plan to publish in their journal, Transportation Research Record. I’m submitting my paper to a different journal for publication, and that journal accepts LaTeX submissions. But if the ultimate destination for your paper doesn’t accept LaTeX or PDFs, take care.

For the record, a little discussion of my adventures in creating all of this. Most of it is fairly straightforward stuff—find the right packages to adjust margins, heading styles, fonts and so on. (Largely, this makes the document more ugly. The TRB journal format is quite unattractive, Word-like and dense, if you ask me.)
The one tricky part was the bibliography style. The recommended TRB citation style is different from any of the built-in LaTeX and BibTeX styles, and I wanted to replicate it correctly. Thankfully, I found the excellent custom-bib program (a.k.a. makebst), which walks through a series of questions to produce a tailor-made Bibliography Style file (bst). I still had to make a few final edits to the resulting bst file (to adjust the volume/number citation style, and technical reports) but thankfully didn’t need to learn much about the cryptic and obscure language they use.
At any rate, it was a surprisingly painless procedure, requiring under a day to get everything working. Now hopefully some other transportation researchers will find this useful and reuse the template.

Thesis: Synthesizing Agents and Relationships for Land Use / Transportation Modelling

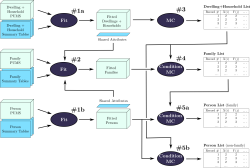
Figure from thesis
I finished my M.A.Sc. degree at the University of Toronto in August. In a past post, I discussed some of the coursework that made up the first year of the degree, but I haven’t really discussed the core research here before. I did win an award for some interim results presented at a local conference, but I wanted to hold back on too much public detail until some of my results were ready for publication. My paper submission to the Transportation Research Board was accepted this week, and my thesis will be formally published by the university next month, so there’s no need to hold back any further.
My research is a small piece of a larger research effort: trying to build integrated land use / transportation models that go beyond traditional transportation models. In classic four-stage models for forecasting travel demand, both the transportation network and the shape of the city (land use) is treated as an input to the model, and the travel patterns that would emerge from such a city are estimated. Typically, the goal is to see how changes to the transportation network would impact travel patterns – for example, building a new freeway or subway route. In reality, however, it is not valid to hold land use constant while changing the transportation network – land use reacts to the presence of transportation infrastructure.
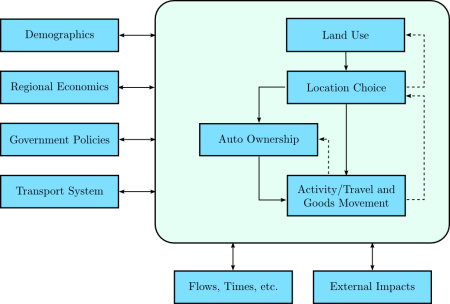
Models of this type have been under development for a long time, and my thesis is part of the ILUTE modelling effort at the University of Toronto. The figure below shows the ILUTE model structure, with land development, household location choice and automobile ownership as integral components of the model, not inputs to the model.
ILUTE model structure
My particular contribution is in the population synthesis part of the model, where I developed a faster and more capable method for synthesizing person, family, household and dwelling agents/objects; and a more robust method for creating the initial relationships between these agents.

  • Presentation: aimed at a fairly general audience (new civil engineering students), but perhaps a little cryptic without the narration.
    [HTML | Powerpoint]
  • Thesis: all of the gory details.
    [HTML | PDF]

Award Winning

At last weekend’s conference for the Canadian Regional Science Association, I presented a paper on Understanding Iterative Proportional Fitting Using Log-Linear Models. At day’s end, I received the Best Student Paper award (in a tie with Marianne Hatzopolous, a Ph.D. student in my lab). Sure, it’s just a small regional conference… but I’m still happy with that outcome.
In other news, we had an interesting tour of Mississauga with former geography professor Gunter Gad. Some of my photos are on Flickr. I’ve visited Mississauga twice on bike in the past year, both times hitting up Port Credit on the waterfront and Square One, the nominal city centre. This conference was at U of T’s Mississauga campus, and I used a combination of GO Transit and cycling to attend. After seeing a broader spectrum of the streets, I’m considerably more pessimistic about the potential for change in travel behaviour or urban form in this city. It’s extremely segregated into residential and non-residential areas, and the pedestrian realm on almost all arterials is utterly bleak. Not bleak in the sense that it’s dangerous or dirty – just extremely monotonous. Given a choice, no one would walk a kilometer along a street like this – and I saw many streets in exactly this style.

The Science Commons

I’ve been writing a short report on open source transportation software, and I ran across an interesting website along the way. Apparently, the Creative Commons people are trying to kickstart a new Science Commons for factual information. Unlike creative content, facts are not covered by copyright protection, but collections of facts (i.e., databases) fall into a grey area and are generally covered.
If you’re intrigued, start with this brief article on the subject. I think it motivates the idea of a Science Commons quite well, particularly the need for machine-readable metadata and broad searchable databases. Back when I worked in computer science, I was really spoiled by the excellent Citeseer article database – there’s no equivalent for transportation/urban planning. While I’m still in university I have good access to databases, but some journals still don’t even have the table of contents online, let alone the articles themselves. (I’m talking about you, Transportation Research Record.)
I’m not naïve enough to think that “data wants to be free!” There are clearly many datasets that will not be collected or maintained without commercial incentives. But there is also a lot of data that is only locked up due to historical quirks in the publishing industry, or political trends in the academic sector to prefer commercialisation and patents to the tradition of open science. Bring on the Neurocommons… but dear god, please find a better name for it.

Scholastica

I haven’t actually written much about my school experience here yet, so I thought I’d at least put up a few sentences on my experience with transportation planning here at U of T.
Last term was crazy busy, although in retrospect much of the burden was self-imposed. Since I was starting a new discipline, I was a bit unsure of myself, and worked very hard initially. Once I got a few papers and midterms back and realized that I was doing okay, I relaxed a bit. I took three courses last term:

  • CIV531 (Transport III: Planning): the course crosslisted as both grad and undergrad, and hence taught in an undergrad style: weekly assignments, midterm/final, and no current research content. One half was focused on planning, and the other half on modelling. As it turned out, I already knew most of the planning side, but the modelling was useful to see in depth.
  • CIV1504 (Applied Probability & Statistics): you would think I’d have covered this somewhere in my undergrad, but it wasn’t part of my engineering curriculum. While I’d done a lot of probability, I’d never learned statistical inference or experimental design. The material was by no means difficult, but we covered a lot of ground in a short time, so there was a reasonable amount of work to do.
  • CIV1535 (Transportation and Development): this was a more typical graduate-level course, focused on recent research findings and a broad overview of literature. Many of the assignments were quite fun, including a book review selected from a few of the major classics. The content had a definite modelling flavour to it, but with plenty of context and insight from Prof. Miller.

I was afraid the program might straitjacket into a very narrow set of courses this semester, but my computer science degree thankfully helps me dodge a bit of the methodology requirements. In the end, it’s a very custom-designed course package, very well suited to my needs. This term I’m taking

  • JPG1510 (Recent Debates on Urban Form): a comparison of three current approaches to city design, New Urbanism, Smart Growth and Compact Cities. These schools derive from different fields: architecture, urban planning and environmental/international (UN) perspectives. The readings, professor and seminar format all appeal to me quite a bit – and I’m really interested by this particular debate.
  • JPG1554 (Transportation & Urban Form): another seminar course, focused on the literature on the feedbacks between transport and urban form. While CIV1535 took the modelling viewpoint, this course takes more of a qualitative tack with some support from the limited quantitative analyses that have been performed. I’ve seen some of this literature before, but it’ll be great to look at it again with a fresh eye and stronger statistical skills.
  • CIV1534 (Transport Demand Analysis): a more practical modelling course, apparently quite tough, but a vital and frequently controversial part of practical transportation projects. The demand analysis conducted on many transit projects has been extremely optimistic; I’ll be curious to see if we look at any of that material this term.

Whew. Does anyone care?

Virtual City

The Globe and Mail had a story today about a very cool website for techie urbanists like me: Virtual City. They’ve digitized streetscapes for a ton of Toronto and Montreal cities, and you can use Google Maps to bring up photos of the street. Great idea, and reasonably well implemented. It clearly still needs a bit of work, but I’m definitely going to start using it now! Give it a shot.
I’m not sure what the business plan is. I suppose it’s useful for finding retail: “there was some funky clothing shop on Queen just west of Spadina… what was it called again?”

Narscissism

No, that’s not a typo. I spent the last three days at the North American Regional Science Conference (NARSC), here in Toronto at the Royal York hotel. It’s probably not the type of conference I would normally attend – the focus is more on regional economic models than transportation or land use – but it was in town, cheap, and a good chance to get a feel for conferences in my new field of study.
My points of reference are the last two academic conferences I attended: SIGGRAPH and Eurographics. Computer science tends to treat conferences as a discussion of published results after peer review is complete. NARSC was more conventional, serving more as a place to discuss works in progress prior to submission to a journal. The cultural differences were large: while the computer science conferences (especially Eurographics) are dominated by under-35s, there were few under 40 here. Supervisors often presented their students’ papers, instead of the other way around. The dress code was a little stiffer than SIGGRAPH: souvenir T-shirts from past conferences would not go over well; suits and ties were the order of the day.
Anyways, it was interesting. I don’t really buy into some of the regional economic models that are used, but it was refreshing to see some people using spatial statistics rigorously, at a level far beyond many papers from urban planning journals. One of these days, I should learn something about these hedonic methods I keep hearing about in econometrics.
I also tried to get some less-techie sessions to balance my mathed-out semester. There was one session discussing the impact of Jane Jacobs, particulary her influence on economists. One presenter argued that Jacobs was really very conservative, an argument that I didn’t entirely buy. He argued correctly that Jacobs was often opposed to government intervention in markets, and large public sector projects in general, often arguing for privatization. This puts her in the same camp as the conservatives, but for very different reasons. Unlike the libertarians, Jacobs did not aim for freedom from government as an end in itself. Instead, her conservative side was rooted in a love of diversity, choice and competition. That’s a type of conservatism that I can definitely buy into. I don’t love or hate government for its own sake, but I do really like choice and diversity, provided that equality, social justice and opportunity also flourish. My objection to the libertarian approach is largely that unregulated markets often don’t lead to diversity, choice and competition, but instead lead to stifling monopolies or oligopolies. And libertarians are frequently content to ignore issues of equality of opportunity and social justice.

AutoDesk Mapguide setup

AutoDesk has a bizarre approach to setting up their Java-based MapGuide client. In theory, it should work on most platforms – but they only document it on Internet Explorer on a few platforms, and on Netscape 4.x on Solaris. On top of that, most of their installation instructions require using an extra Java applet to do the installation, or downloading a big shell script for Solaris.
I got it to work under Mozilla Firefox on Linux, and I’m sure it would work like this on Windows or MacOS as well. Here’s how I did it; adapt my approach to your setup.

  1. Download the JAR archive (mgjava.jar) from here.
  2. Try to figure out where to install it. I did this by visiting the VanMap website, which fails to load since it can’t find the JAR file. I right-clicked on the broken Java applet, which brought up a menu that allowed me to open the Java console. On my Java installation (J2RE 1.4), I got an error message like this:

    load: class com/autodesk/mgjava/MGMapApplet.class not found.
    java.lang.ClassNotFoundException: com.autodesk.mgjava.MGMapApplet.class
    at sun.applet.AppletClassLoader.findClass(AppletClassLoader.java:162)
    at java.lang.ClassLoader.loadClass(ClassLoader.java:289)
    at sun.applet.AppletClassLoader.loadClass(AppletClassLoader.java:123)
    at java.lang.ClassLoader.loadClass(ClassLoader.java:235)
    at sun.applet.AppletClassLoader.loadCode(AppletClassLoader.java:566)
    at sun.applet.AppletPanel.createApplet(AppletPanel.java:617)
    at sun.plugin.AppletViewer.createApplet(AppletViewer.java:1863)
    at sun.applet.AppletPanel.runLoader(AppletPanel.java:546)
    at sun.applet.AppletPanel.run(AppletPanel.java:298)
    at java.lang.Thread.run(Thread.java:534)

    and instructions telling me to press “s” to view the system properties. I did that, and found the Java CLASSPATH setting java.class.path = /usr/lib/j2se/1.4/jre/classes. If you can find that classpath setting, you’re good to go.
  3. Go to the classpath directory. On my system, the “classes” subdirectory didn’t exist and I had to create it. Unzip the mgjava.jar file to there (yes, JAR files are just zip archives).
  4. Restart Firefox. Visit the VanMap website again and see if everything’s working.

This whole procedure is amazingly painful. Debian’s documentation claims that the classpath is something different – they say it’s in /usr/share/java/repository. There are some jar files in /usr/share/java, but there is no repository directory. Installing the jar file there didn’t help at all. It’s also annoying that you have to unzip the jar file – that wasn’t obvious to me at all. Sigh… at least I’ve got it working now.