All posts by admin

C++ Stack Traces on UWP

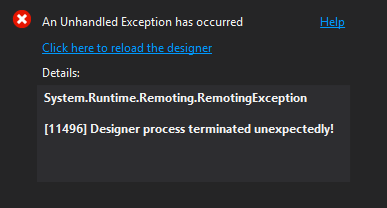
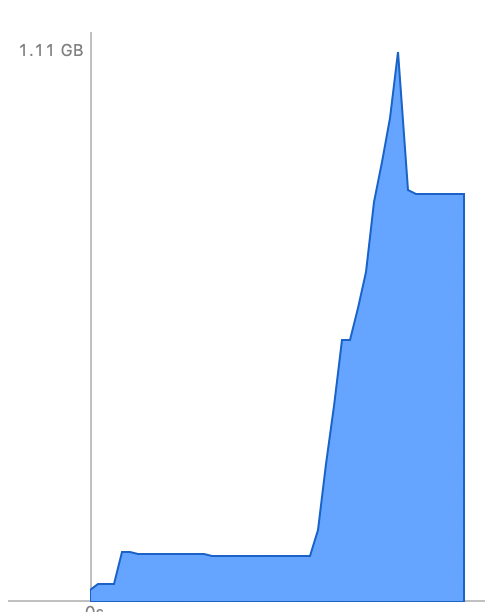
In early 2019, I was working on an app (Mental Canvas Draw) that was in private beta on the Windows Store. There was a nice, robust system to show you which crashes were most common your app. Then suddenly – it disappeared, and instead there was a big stream of “Unknown” class crashes.

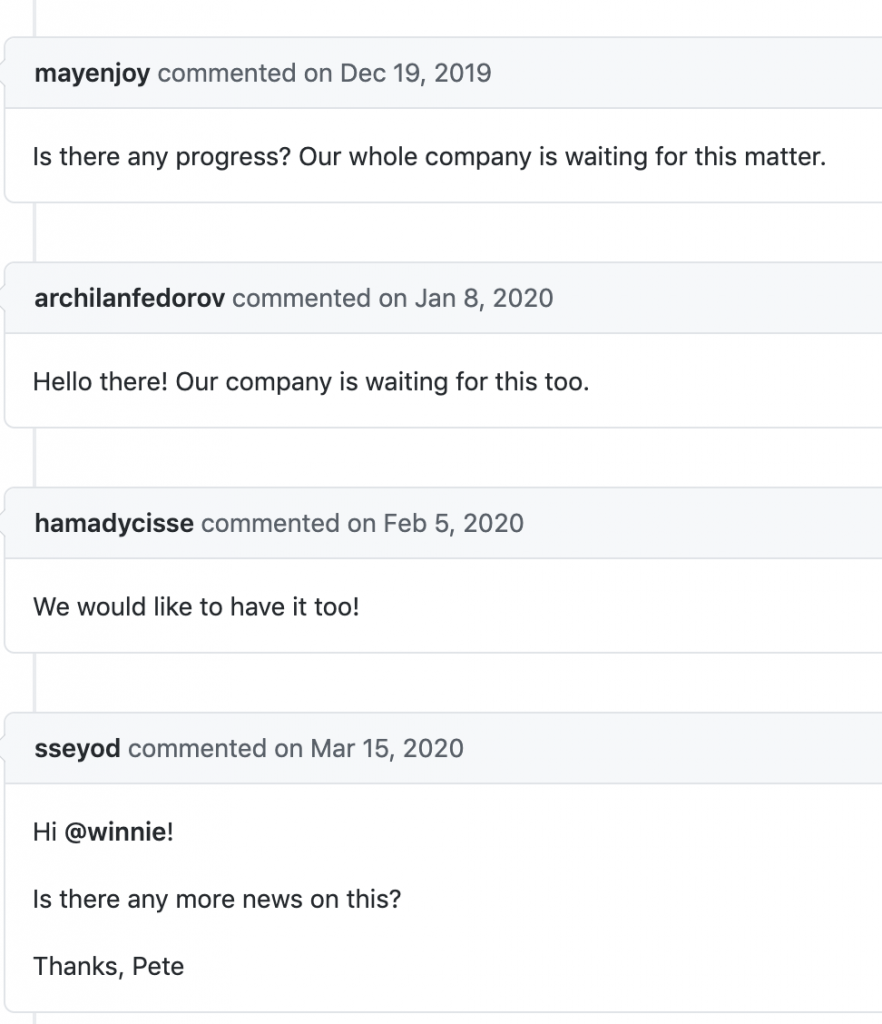
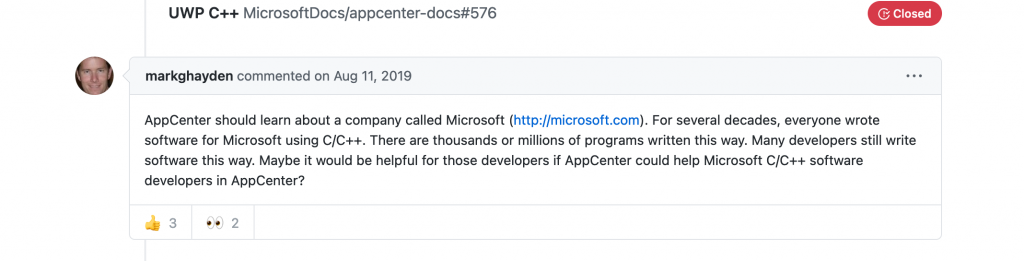
This caused much wailing and gnashing of teeth. I assumed that it would be fixed. Microsoft had recently acquired HockeyApp and was revamping it into Visual Studio AppCenter. Surely that would provide a replacement! Six months passed, a year passed, two years passed, and… nothing for C++ users. (I understand that AppCenter provides a solution for C# users.)

Some wailing
Some gnashing of teeth

That app was released widely in March 2021, and I realized an important fact: if you have a large volume of users and/or crashes, you get a valid list of stack traces! There seems to be something about the level of usage per package version that’s important. For <100 crashes per version, I get 0% stack traces; for <250 I get very few; and for the version with 750 crashes I get good (64%) stack traces.

Sample sizeFilter Type% Unknown% Stack Traces
1,051None50%50%
750Package version36%64%
485OS version54%46%
316OS version34%66%
234Package version86%14%
110OS version50%50%
100OS version99%1%
66Package version100%0%

Even for the “higher usage” package version, however, I’m still not getting solid data on the “rare” crash types – just the frequent crashes.

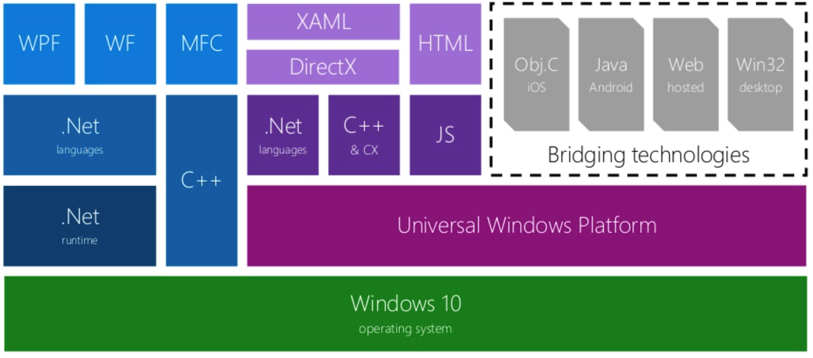
So… what’s to be done? We don’t have access to any off-the-shelf Win32 crash reporting tools, as the necessary APIs are all blocked off from UWP apps. There’s no easy way to get a minidump. There might be some really elaborate solution involving Project Reunion APIs to monitor the UWP process from Win32-land, but I haven’t explored those technologies much, and I’m not confident that the Win32 code gets sufficient privilege to dig deep on the UWP process’ behaviour.

But… UWP apps do have access to one key API: CaptureStackBackTrace.

A bare bones solution

A full-fledged crash handling and stack trace solution is quite complicated: running in a separate guard process to sidestep any memory/stack corruption; multiple threads; full analysis of both the app portion of the stack trace and the system (Windows) portion. My main needs were more narrow, and I built a solution focused on that

  • Single thread: only show stack of active (crashing) thread
  • App portion of stack is critical; system/Windows portion is desirable, but less important
  • Severe memory corruption doesn’t need to be handled initially
  • Only handle C++/CX and x64. It probably works for other situations, but that’s all I’ve tested to date.

With those criteria, I came up with a five-part solution:

  1. Pre-crash: log system info to disk
  2. Crash time: set a callback to get notified, and capture stack to disk
  3. Next app startup: transmit log+stack trace to server
  4. [OPTIONAL] Server: symbolify stack trace
  5. [OPTIONAL] Server: aggregate results

Let’s take a quick look at each piece.

Log System Info

When the crash happens, we want to do the bare minimum necessary. Memory may be corrupted and we want to avoid crashing while trying to log the crash. So: we log system information to disk at startup, prior to any crash happening. We particularly need the app version and the operating system version in order to be able to symbolify the stack trace, and the date/time of the session; but of course other data (screen size, RAM available, graphics driver versions, etc.) may also be relevant.

Crash Capture: Callback on Crash

There are several potential mechanisms to get notified on crashes:

  • Assertion failures (if enabled in production): it’s easy enough to write a custom assertion macro that captures __LINE__ and__FILE__ to get the source location of a failure, and it can then also trigger capture of a stack trace.
  • Invalid memory access: the best bet seems to be __try / __catch / _set_se_translator for Windows Structured Exception Handling (SEH)

These were also options, but didn’t seem to actually get called for relevant situations like null pointer dereferences:

  • A different SEH Win32 C API: SetUnhandledExceptionFilter
  • UWP event handlers: Windows::ApplicationModel::Core::CoreApplication::UnhandledErrorDetected and Windows::UI::Xaml::UnhandledException

What is SEH? It’s a C API that handles hardware exceptions on x86/x64 chips; while it uses the __try and __catch keywords, it’s not about software exceptions (either C++ or managed code). There’s some good discussion of it in the CrashRpt documentation. It’s a key part of Microsoft’s own error reporting mechanism, from the Dr. Watson era through to today. (I believe the rough data path is SEH → Windows Error Reporting (WER) → Microsoft-hosted database → Windows Store stack traces.) There are all sorts of complicated nuances to how it works, and I’ve understood… relatively few of them. I just use the _set_se_translator function as a hook to:

  • Get called when a crash happens, on the crashing thread.
  • Grab a stack trace and record it (typically skipping the first 8 frames that are in VCRUNTIME and NTDLL)
  • Also grab and record the exception type (EXCEPTION_ACCESS_VIOLATION, EXCEPTION_STACK_OVERFLOW, etc.)

A single call to _set_se_translator appears to be sufficient to get a callback when any thread crashes. (Which is the main reason I use it instead of __try / __catch or _set_terminate, which have to be applied on a per-thread basis.)

The actual implementation is pretty straightforward:

#include <eh.h>

void se_trans_func( unsigned int u, _EXCEPTION_POINTERS *pExp) {
  // Skip 8 stack frames - we usually see the ones below.
  // 00:MyApp.exe+0x009a7b98		(this function)
  // 01 .. 05:VCRUNTIME140D_APP.dll
  // 06 .. 08:ntdll.dll
  Char *backTrace =GetBackTrace(8);
  Str desc;
  switch (u) {
  case EXCEPTION_ACCESS_VIOLATION:
    desc = L"ACCESS_VIOLATION";	     break;
  case EXCEPTION_ARRAY_BOUNDS_EXCEEDED:
    desc = L"ARRAY_BOUNDS_EXCEEDED"; break;
  // ... etc. ...
  case EXCEPTION_STACK_OVERFLOW:
    desc = L"STACK_OVERFLOW";        break;
  default:
    desc = StrPrintf(TEXT("%d"), u); break;
  }

  LogPrintf(L"Structured Exception Handling failure type %s. Stack trace:\n%s\n"),
    desc.Data(), backTrace);
  delete[] backTrace;

  // A bit irrelevant... we mostly just want the stack trace.
  throw L”Hardware exception”;
}

App::App() {
  // ...
  _set_se_translator(se_trans_func);
  // ...
}

Crash Capture: Record Stack Trace

From a UWP app, we don’t have access to many Win32 APIs – but we can call CaptureStackBackTrace. If we combine that with calls to RtlPcToFileHeader and GetModuleName, then we can get the module name (EXE and DLL filename) and the offset within that module for each entry in the stack trace. Unlike conventional Win32 crash handlers, we cannot symbolify at crash time. We get a module-relative offset:

myapp.exe+0x00001234

Rather than the symbolified (actual function name and signature) with a function-relative offset:

myapp.exe crashyFunction(int, const std::string &) + 0x0000001a

Or even better, with source filenames and line numbers:

myapp.exe crashyFunction(int, const std::string &) + 0x0000001a
myapp.cpp:465

In theory, you could try to walk the module’s PE header data manually with an IMAGE_DOS_HEADER to get the IMAGE_EXPORT_DIRECTORY for the exported symbols from each module. But in practice, we need non-exported private function names, for both trace entries in our code and in Windows DLLs.

So – there’s no API call to do the symbolification locally in-app. We’ll have to do it out-of-app with the help of a server. Given that situation, we just dump the CaptureStackBackTrace outputs to disk, and let the app merrily crash.

The actual capture code looks like this:

Str GetBackTrace(int SkipFrames)
{
  constexpr uint TRACE_MAX_STACK_FRAMES = 99;
  void *stack[TRACE_MAX_STACK_FRAMES];
  ULONG hash;
  const int numFrames = CaptureStackBackTrace(SkipFrames + 1, TRACE_MAX_STACK_FRAMES, stack, &hash);
  Str result = StrPrintf(L"Stack hash: 0x%08lx\n", hash);
  for (int i = 0; i < numFrames; ++i) {
    void *moduleBaseVoid = nullptr;
    RtlPcToFileHeader(stack[i], &moduleBaseVoid);
    auto moduleBase = (const unsigned char *)moduleBaseVoid;
    constexpr auto MODULE_BUF_SIZE = 4096U;
    wchar_t modulePath[MODULE_BUF_SIZE];
    const wchar_t *moduleFilename = modulePath;
    if (moduleBase != nullptr) {
      GetModuleFileName((HMODULE)moduleBase, modulePath, MODULE_BUF_SIZE);
      int moduleFilenamePos = Str(modulePath).FindLastOf(L"\\");
      if (moduleFilenamePos >= 0)
        moduleFilename += moduleFilenamePos + 1;
      result += StrPrintf(L"%02d:%s+0x%08lx\n"), i, moduleFilename, 
        (uint32)((unsigned char *)stack[i] - moduleBase));
     }
     else
       result += StrPrintf(L"%02d:%s+0x%016llx\n"), i, moduleFilename, 
         (uint64)stack[i]);
   }
   return result;
}

Next App Startup: Transmit Log

The UWP lifecycle APIs let us detect whether the last run of the app had a clean exit. We can use that to detect a crash, and transmit the recorded log to our server for symbolification. It does mean that we don’t get crashes immediately, and we may miss crashes if the user doesn’t restart the app. But in practice, this is largely acceptable.

We do try to capture the app version and crash date/time in our log, as the version and date may be different by the time the log is transmitted.

[OPTIONAL] Symbolify Stack Trace

The server is – by necessity – a Windows VM listening to HTTPS requests.

On the server, we maintain a set of PDB files for each app version (extracted from the .msixpackage zip file). At present, we only handle x64 and not ARM64 crashes.

We also maintain a set of key system DLLs for each major (semiannual) Windows release. We don’t try to keep the DLLs for each minor release, as that’s basically a Herculean task.

When a log file comes in, we:

  • Parse the log to retrieve the app version and Windows version
  • Match up the relevant PDB file and directory of Windows system DLLs
  • For each line of the stack trace, detect whether it’s in our app or a system DLL
  • Run CDB.EXE to convert the module name + offset to a function name, offset, source filename and line number. The inspiration for this came from Raymond Chen’s oldnewthing blog.

The heart of this is the call to CDB, which looks like this:

export CDB=/mnt/c/Progra\~2/Windows\ Kits/10/Debuggers/x64/cdb.exe
# Typical raw output, prior to sed expressions:
#   MyApp!MyApp::App::CrashyFunction+0x25fb
#   [C:\Users\MyUser\source\myapp\MyApp.cpp @ 757]:
# Sed expressions simplify it to:
#   App::CrashyFunction+0x25fb [MyApp.cpp @ 757]
"$CDB" -lines -z myapp.exe -c "u $entry; q" -y \
  "cache*c:\\Symbols;srv*https://msdl.microsoft.com/download/symbols"\
  | grep -m 1 -A 1 "^0:000>" \
  | tail -1 \
  | sed 's/:$//;' \
  | sed 's/MyApp:://g;' \
  | sed 's/\[[^@[]*\\\([A-Za-z0-9_.]*.\(h\|cpp\) @ \)/\[\1/g'

For Windows system DLL entries, we can choose a $SYS32DIR to match the client’s Windows version, and then change the -z argument to

-z $SYS32DIR\\$DLLFILENAME

This ensures that CDB uses the client’s Windows version to decide which symbols to retrieve for the DLL, rather than the normal behaviour, which would use the server VM’s Windows version. We’ll still get a fair bit of mismatch – as we usually don’t have the DLLs that precisely match the client’s Windows version.

If there’s some way to specify a Windows version when telling CDB about the symbol server – let me know! That would be a huge timesaver.

[OPTIONAL] Aggregate results

Ideally, we want to build a database of all stack traces, merge duplicates, and present a ranked list of the most common crashes over (say) a month, and a graph of the crash frequency of any given bug per day.

But I haven’t actually implemented this yet. For this purpose, an off-the-shelf tool will probably suffice – a service like Sentry or Visual Studio App Center would do the trick, and both accept submission of crash data via an API.

What if we don’t symbolify?

If you want a simpler solution: you can easily use the module name + module-relative offset in a Visual Studio debugger session to manually find the source location. This makes it painstaking to analyze each individual crash, but might be acceptable if you maintain a very low crash rate in your app. I took this route through 2019, but added stack trace capture by 2020 and finally built out the symbolification code in 2021 when it became obvious that Microsoft wasn’t going to fix this themselves.

Conclusion

So – this is a very bare bones process for detecting crashes, capturing a C++ stack trace, transmitting to a server and determining filename + line numbers for each entry in the stack trace.

I … still really wish Microsoft would just re-enable this code in the Microsoft Store. For the life of me, I can’t understand why they turned it off. They must still be collecting all this information in the WER database for their own use, and just not exposing it to developers.

Pitfalls mixing PPL+await

Imagine you have a C++/CX codebase with a lot of asynchronous logic written using the classic Parallel Patterns Library (PPL) tasks:

task<void> FooAsync(StorageFolder ^folder) {
  return create_task(folder->TryGetItemAsync(L"foo.txt"))
    .then([](IStorageItem ^item) {
      // do some stuff, cast to a file, etc.
    });
}

It’s all running on the UI thread, so it’s in a Single Threaded Apartment, and each task in your chain of .then() continuations is guaranteed to also be on the UI thread.

Now, you learn about Microsoft’s relatively new co_await feature, recently accepted in an adapted form in the C++20 spec. So you start using it:

task<void> FooAsyncCo(StorageFolder ^folder) {
  IStorageItem ^item =
    co_await folder->TryGetItemAsync(L"foo.txt");
  // do some stuff, cast to a file, etc.
}

So far so good: all code inside FooAsyncCo() also runs on the UI thread, nice and clean.

Finally, you integrate a little of this co_await code into your heavily PPL codebase. Helpfully, co_await returns a task, just like your existing async PPL method. Another developer sees that you have a bunch of methods returning task<void> and decides to start building on that API using PPL:

FooAsyncCo().then([]() {
  // more stuff, after coroutine.
  // KABOOM. Running on a threadpool thread, *not* the UI thread.
  // We accidentally busted out of the STA.
});

Uh-oh. When you mix the two async approaches… things break. And none of the documentation – or honestly anything I’ve read on the web to date – gives any hint of this issue.

Not A Fix

Well… let’s see. The docs do give us one tip: a task chain is only guaranteed to remain inside the Single Threaded Apartment if the chain starts with an IAsyncAction or IAsyncOperation

The UI of a UWP app runs in a single-threaded apartment (STA). A task whose lambda returns either an IAsyncAction or IAsyncOperation is apartment-aware. If the task is created in the STA, then all of its continuations will run also run in it by default, unless you specify otherwise. In other words, the entire task chain inherits apartment-awareness from the parent task. This behavior helps simplify interactions with UI controls, which can only be accessed from the STA.

Asynchronous programming in C++/CX: Managing the Thread Context

Well… TryGetItemAsync does return an IAsyncOperation. That would appear to be the root task in the chain… so coroutines must be treated differently, with the coroutine itself being the root.

Well, what if we tried making the coroutine return an IAsyncAction?

IAsyncAction ^FooAsyncCoAction(StorageFolder ^folder) {
  return create_async([folder]() -> task<void> {
    // KABOOM - this is now out of the apartment.
    IStorageItem ^item =
      co_await folder->TryGetItemAsync(L"foo.txt");
    // do some stuff, cast to a file, etc.
  });
}
create_task(FooAsyncCo())
.then([]() {
  // more stuff, after coroutine.
  // ok now!
});

No dice. Now the coroutine runs off-thread, while the continuation runs correctly on the UI thread.

Two Actual Fixes

With a little more reading, I found Raymond Chen’s blog post about PPL and apartment-aware tasks. That led to this successful solution:

task<void> completed_apartment_aware_task() {
  return create_task(create_async([](){}));
}

completed_apartment_aware_task()
.then(FooAsyncCo)
.then([]() {
  // Ok!
});

This one actually works. By rooting the PPL chain in an IAsyncAction, the rest of the chain retains apartment awareness, and everything stays on the UI thread.

And I’d earlier found a different but more fragile solution:

create_task(FooAsyncCo, task_continuation_context::use_current())
.then([]() {
  // Ok!
});

While this works, it’s… a bit hard to tell whether the root task, or the continuation, or what-all needs use_current(), and it’s always felt fragile to me. And if it gets called from a threadpool thread, it’s unclear to the caller what happens with use_current().

Conclusion

I’ve got to say… this is a brutal pitfall. Any existing codebase is going to have a lot of PPL tasks in it, and wholesale migration to co_await isn’t going to happen all in one go, at least if there’s any conditional/loop/exception logic in the PPL-based code. Anyone who’s tried to migrate to co_await has probably run into this pitfall.

We haven’t adopted the completed_apartment_aware_task() as a root task throughout our codebase yet, but I’m hopeful that will at least offer a path forward. Just… still quite error-prone.

A Windows to iOS Port

My main activity of 2019 was a port of the Mental Canvas 3D drawing tool from Windows to iOS. About 75% of my effort was user interface code, maybe 15% on graphics and 10% other platform issues.

What’s interesting about our porting approach? Well, it’s just an unusual mix:

  • It’s a UWP (Universal Windows Platform) app. UWP was Microsoft’s effort to modernize Win32 and add iOS mobile paradigms, so it is already touch-centric, relatively sandboxed and has a more mobile-like lifecycle
  • We didn’t use React Native, Flutter, Electron, Xamarin, Qt or even Fuschia’s namesake Pink. We just… wrote some native code. And a lightweight abstraction layer.
  • We completed the porting effort in seven months, with three developers.
  • We stayed with the MVVM architecture that is the norm on Windows. Many iOS developers would call that… exceptionally ok
  • We didn’t use the latest and greatest Swift tools, just plain old C++11 and Objective-C for the most part. We didn’t switch to SwiftUI when it was released half way through our port.

What combination of circumstances led to this approach? Mostly just a real life constraint: a desire to rewrite/redesign as little working code as possible, and keep the codebase’s size down.

  1. Starting Point
  2. UI Framework Choice
  3. Restructuring the UI Thread
  4. Lightweight iOS Bindings
  5. What About SwiftUI?
  6. Incremental Porting
  7. The Upshot: Code Reuse
Continue reading A Windows to iOS Port

Metal Memory Debugging

At Mental Canvas, Dave Burke and I recently resolved a memory leak bug in our iOS app using the Metal graphics libraries. Memory management on Metal has had a few good WWDC talks but has surprisingly little chatter on the web, so I thought I’d share our process and findings.

  1. The issue: a transient memory spike
  2. iOS / iPadOS memory limits
  3. Forming hypotheses
  4. Tools at hand
  5. Findings
  6. Conclusion
  7. References

The issue: a transient memory spike

Our sketching app does a lot of rendering to intermediate, offscreen textures. In the process, we generate (and quickly discard) a lot of intermediate textures. A lot of that rendering happens in a continuous batch on a dedicated thread, without yielding execution back to the operating system.

A consequence of that behavior: our memory footprint grows rapidly until we hit the critical threshold — on a 3 GB iPad Air, about 1.8 GB — and then iOS summarily kills the app. From our app’s perspective, memory footprint is only growing gradually, as most of the memory usage is temporary intermediate rendertargets; they should be freed and available for reuse. But from the operating system’s perspective, it considers all of those temporaries to still be in use.

Which led us to the question: why? And how do we figure out which temporaries are leaking, and which Metal flag / call will allow us to return that data to the operating system?

Continue reading Metal Memory Debugging

Adventures in Vintage Emme

Imagine there are no variable names. Imagine working – in 2016 – with registers. Imagine one minute file load times. Imagine that all commands are just numbers. Imagine there’s no usable string processing.

Welcome to Emme 3. During the years that I worked in travel demand forecasting, this was the main tool available to me.

Emme was undoubtedly a trailblazing innovator when it first came out in 1982 and remained a power user’s dream through to the early 90s. But it clearly missed the Windows boat; the software seems to have stagnated until beginning a revival in the late 00s.

Emme 2’s graphical capabilities
Continue reading Adventures in Vintage Emme

Working with XAML Designer 2 (UwpSurface)

In September 2017, Microsoft released a rewritten XAML Designer program within Visual Studio. It’s only enabled for a tiny fraction of apps and got a very quiet launch, so almost no one knows about it. The new version runs as UwpSurface.exe instead of XDesProc.exe and is only enabled for UWP apps targetting Fall Creators Update SDK or newer.
For my app, the new Designer simply broke everything initially. Why? Presumably for technical reasons, it only works with {Binding} and not {x:Bind} – but this was not made at all clear in the launch announcements. UWP developers have been encouraged to use {x:Bind}: it’s compiled, type-safe and faster, and x:Bind functions are the only way to do multibinding. For my 64-bit app, I never got design data or design instances working under XAML Designer (xdesproc), so I relied entirely upon {x:Bind}‘s FallbackValue parameter to preview different modes of my UI – but {Binding} has no equivalent mechanism.
After a lot of tinkering, I’ve finally learned a few important things about the new XAML Designer, and got a usable workflow.

Top Takeaways

  • UwpSurface is much faster and stabler than XDesProc. The dialog above (“Click here to reload the designer”) is largely history.
  • It works for both 32-bit and 64-bit apps (x86 or x64), which is a big step forward
  • Only {Binding} is evaluated; {x:Bind} is completely ignored.
  • DesignInstances (a live ViewModel) can be attached via DataContext or d:DataContext, although the DesignInstance parameter doesn’t seem to work
  • ViewModel code executes, but I don’t see any indication that View code executes, despite discussion to the contrary in Microsoft’s launch blog post
  • For C++/CX apps: due to a bug, only single-class ViewModels (without any C++/CX base classes) work as of Visual Studio 15.8.x. They’re fine in C#.
    (Update Jan. 2019: Visual Studio 15.9 fixed this bug, but ViewModels that implement property change notifications still do not work.)
  • You can attach a debugger and see debug output from your ViewModel, or any exceptions. I haven’t been able to set breakpoints.
  • Update Jan. 2019: Visual Studio 15.9 added support for something I requested in mid-2018: the FallbackValue parameter was added to {Binding}, which makes that an equally viable way to work with XAML Designer. FallbackValue doesn’t work for {x:Bind} in the new Designer.

My strategy for a C++/CX app

  • Stick with {x:Bind} and its functions in most of my code
  • For the few properties that are central to a clean layout (usually about 2-5), use {Binding} and type converters
  • For those properties, build a duplicate “DesignTimeMock” ViewModel class – with no C++/CX base classes – and return the design-time property values there. Most properties can be safely omitted.
  • In the XAML code, define two different DataContexts like this:
    <UserControl.DataContext>
        <local:MyViewModel />
    </UserControl.DataContext>
    <d:UserControl.DataContext>
        <local:MyViewModel_DesignTimeMock/>
    </d:UserControl.DataContext>

    This attaches one ViewModel for runtime, and the mock for design time.

  • Update Jan. 2019: Visual Studio 15.9 now allows a different approach: instead of a DesignTimeMock, you can just have a single DataContext using the “real” view model, but instead change {x:Bind} to {Binding} in the few places where it matters, and then add a FallbackValue parameter to choose the desired value in XAML Designer. The biggest advantage of FallbackValue: you can edit it in place and see it immediately update, without recompiling and relinking the DesignTimeMock view model.

It’s not ideal. But… it’s better than nothing.

Closing Thoughts

Despite the difficulties, I do look forward to further improvements in the XAML Designer. The old version was dated and crash-prone, and a clean slate rewrite was the only reasonable path forward. It’s just going to take some time to reach feature parity with the old version, which will mean some teething pain for “guinea pig” developers like myself.

Asynchronous Best Practices in C++/CX (Part 2)

This is part two in a series of articles on asynchronous coding in C++/CX. See the introduction here.

  1. Prefer a task chain to nested tasks
  2. Be aware of thread scheduling rules
  3. Be aware of object and parameter lifetimes
  4. Consider the effect of OS suspend/resume
  5. Style: never put a try/catch block around a task chain.
  6. References

2. Be Aware of Thread Scheduling Rules

Asynchronous Best Practices in C++/CX (Part 1)

For me, the steepest learning curves with the Universal Windows Platform (UWP) was the use of asynchronous APIs and the various libraries for dealing with them. Any operation that may take more than 50ms is now asynchronous, and in many cases you can’t even call the synchronous equivalent from Win32 or C. This includes networking operations, file I/O, picker dialogs, hardware device enumeration and more. While these APIs are pretty natural when writing C# code, in C++/CX it tends to be a pretty ugly affair. After two years of use, I now have a few “best practices” to share.
C++/CX offers two different approaches for dealing with asynchronous operations:

  1. task continuations using the Parallel Patterns Library (PPL)
  2. coroutines (as of early 2016)

Personally, I vastly prefer coroutines; having co_await gives C++/CX a distinctly C# flavour, and the entire API starts to feel “natural.” However, at my current job we have not yet standardized on coroutines, and have a mix of both approaches instead. And to be fair – despite Microsoft’s assurances that they are “production ready”, I’ve personally hit a few coroutine bugs and they do occasionally completely break with compiler updates.
I’m going to write up my advice in a series of posts, as the examples can be pretty lengthy.

  1. Prefer a task chain to nested tasks
  2. Be aware of thread scheduling rules
  3. Stay aware of object and parameter lifetimes
  4. Consider the effect of OS suspend/resume
  5. Style: never put a try/catch block around a task chain.
  6. References

1. Prefer a Task Chain to Nested Tasks

When writing a series of API calls that need local variables, conditional logic, or loops, it’s tempting to write it as a nest of tasks. But a nest will:

This One Weird Grid Trick in XAML

I recently found a neat XAML user interface trick that I hadn’t seen in my usual resources. Suppose you have:

  • a grid-based responsive user interface that you want to grow/shrink to fit the window
  • suppose it has a fixed width, and each row has a “core” minimum height it needs.
  • then there’s some extra vertical space that you want to sprinkle around
  • you have some priorities – first give row #1 extra space, then row #2 any extra.

XAML makes it easy to do proportional space allocation – e.g., give row #1 two-thirds and row #2 one-third by giving them “2*” and “*” height respectively. But it doesn’t do priorities.
The trick: combine a massive star size with a MaxHeight. That looks like this:

<Grid>
  <Grid.RowDefinitions>
    <RowDefinition Height="1000*" MaxHeight="200" />
    <RowDefinition Height="*" />
  </Grid.RowDefinitions>
</Grid>

Essentially, row #1 gets “first claim” on any extra space, up to a limit of 200 pixels. Any extra space beyond 200 pixels falls over to row #2.

My First XAML Tips for the Universal Windows Platform

I’m a latecomer to Microsoft’s user interface technologies. I never used Windows Framework (WPF) on top of .net and I never used Silverlight on the web. The last year was my first taste of these tools through the XAML framework that is part of the “Universal Windows Platform” (UWP) – that is, the Windows 10 user interface layer (and Win8).
XAML has steadily evolved since the WPF days, and it took a little while to really understand the different major eras of the technology, especially since the UWP flavour of XAML strips out some of the older syntaxes in the name of efficiency on mobile platforms, better error checking at compile-time and code readability and ease-of-use. The technology’s old enough that much of the Google search hits and StackOverflow results are not applicable on the modern UWP platform.

My Tips

So what were a few of my first lessons when using XAML on UWP?
Continue reading My First XAML Tips for the Universal Windows Platform