screenshots.
The screenshots shown here were generated with the latest version of Freecloth, 0.7.1.
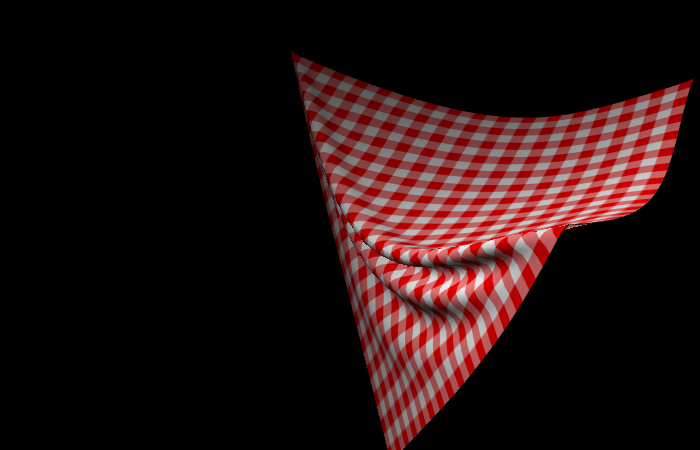 |
Three corners are held fixed with position constraints, while the fourth corner falls over 2.5 seconds. See the movie [mpeg]. Compute time: 15 minutes, 25 seconds on a 1.6 GHz Pentium IV. |
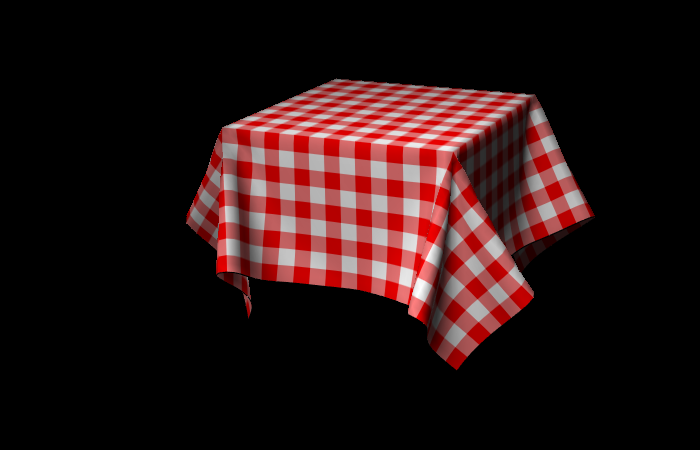 |
A tablecloth settles on a square table over 2.5 seconds. See the movie [mpeg]. Compute time: 5 minutes, 15 seconds on a 1.6 GHz Pentium IV. |
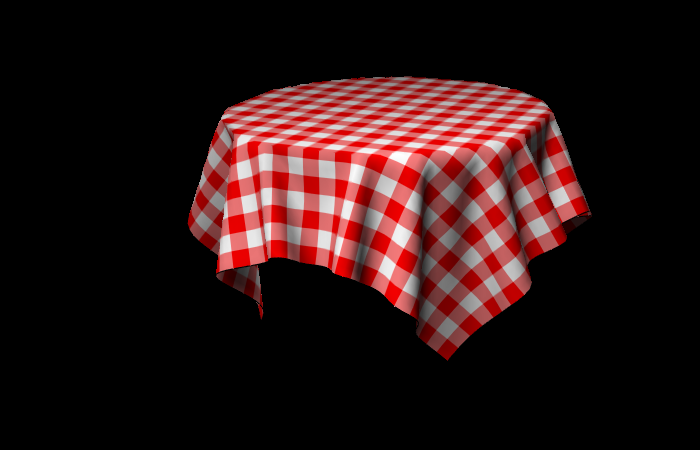 |
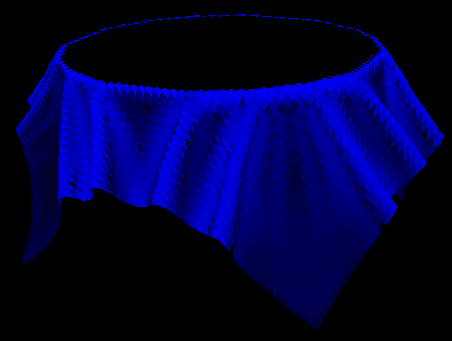
A tablecloth settles on a circular table over 2.5 seconds. See the movie [mpeg]. Compute time: 4 minutes, 45 seconds on a 1.6 GHz Pentium IV. |
analysis.
I intend to analyse the effects of different parameters on the cloth simulation, which hasn't been done much in existing cloth simulation literature.
The complete analyses are listed below.
- Constraints: impact of different types of constraints on the cloth motion: holding one corner, holding the centre, or forming a tablecloth.
- Number of patches: impact of number of patches on simulation.
- Density: impact of density (and hence total mass) on simulation.
- Stretch constant: effect of more or less stretch in simulation.
- Shear constant: effect of more or less shear in simulation.
- Bend constant: effect of more or less bend in simulation.
- Stretch damping constant: effect of more or less damping of stretch forces in simulation.
- Shear damping constant: effect of more or less damping of shear forces in simulation.
- Bend damping constant: effect of more or less damping of bend forces in simulation.
- Drag constant: effect of more or less air drag in simulation.
- Stretch limit: effect of changing to maximum acceptable stretch in adaptive time stepping.
- PCG tolerance: effect of changing stopping tolerance for PCG algorithm.
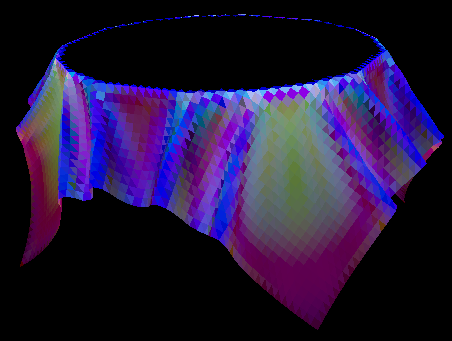
In the various analysis pages, images of energy distributions across the cloth are often shown. These images are visualisations of three types of cloth energy: stretch, shear and bend energy. Stretch is shown in red, shear in green, and bend in blue; they combine to form a rainbow image, as shown below. Intensities in these images are on a logarithmic scale, where black is an energy of 10-8 or lower and full intensity represents an energy of 10-4 or higher.
 |
 |
 |
 |
| Stretch | Shear | Bend | All |
The energy visualisations also have a graph showing the total energy in the cloth over time, divided into stretch, shear and bend components. In these graphs, the same colour scheme is used, but the scale is linear.
Each of these analyses was computed on a 1.6 GHz Pentium IV system. Compute times are given above the link to the movie.